Oberon System Instrumentation GUI
Synopsis. Simple yet effective Graphical User Interface is one of the assets of the instruments which use Oberon System. In this section I will outline how the Oberon System instruments can interact with the user.
Motivation. In theory, GUI is secondary in scientific instruments (we scientists can endure anything). In practice a good, responsive, and aesthetically pleasing GUI is an important part of the instrument. How to develop such a GUI without dominating the development with secondary bells and whistles? We found that Linux and the Web - based GUI incurred a lot of cost and effort to the development cycle of our advanced nuclear instruments. We now want to explore whether instruments could use the less resource - hungry Oberon System together with its GUI.
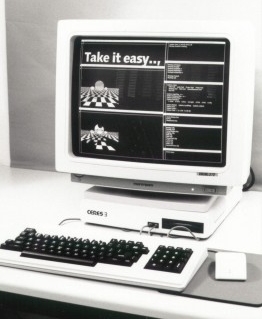
Background information. The original Oberon GUI running on the Ceres computer was designed in late 1980's. Oberon creators acknowledged being inspired by the early GUIs developed at the Palo Alto Research Center (PARC). The Windows or Mac ideas could not be incorporated into the the Oberon GUI which was developed prior to either Windows or Mac. This is why the classic Oberon GUI looked different from the GUIs which later dominated the market. When the Oberon System was re-released by Professor Niklaus Wirth and Paul Reed in 2013, the authors kept the original GUI, even though it looked a bit out of date. The framebuffer consisting of only 1024*768 bits (98,304 bytes) was permitted by the available memory of only one megabyte.
Oberon GUI evolution. The original Oberon GUI was basically a wordprocessor, though it was also fully capable of graphics, as shown in the figures below. The tiled windows were characteristics of this GUI, which was later extended in two different directions. The so-named Version 4 (V4 in short) added the pull down menus, buttons, check boxes, hyper text links, and other similar elements. It looked a bit like a plain HTML Web browser, even though the underlying technology was quite different. All of this was achieved within the original tiled windows design. The so-named System 3 implemented the desktop metaphor, with the tiled windows and a rich set of graphical widgets. It also supported the original tiled windows as a default, while the desktop was optional.
Going back to the original tiled GUI. The creators of the FPGA Oberon System went back to the original design out of neccessity. The memory on the Spartan-3 Starter Kit was sufficient neither for handling the overlapping windows, nor for the color. The FPGA Oberon System, named V5 in Oberon genealogy, was in fact more like the original Version 1. Such a frugal design provides quite a reasonable design for instrumentation, even though it will definitely benefit from reintroducing color.
Comparison of tiled versus overlapped windows GUI. Since both paradigms are provided under System 3, one can try using both under the same System. The Oberon community is divided about 50/50 in favor of one versus the other. I myself prefer the tiled windows, because they provide a very efficient software development environment. The window manager is also much simpler internally because overlapping window areas do not have to be handled.
Summary. The original Oberon System Version 1 tiled windows display was reintroduced into the 2013 FPGA Oberon System (i.e., Version 5) after thirty years of trying alternative solutions. This decision was dictated by very limited resources on the Spartan-3 board. It is also a very reasonable choice for the instrument GUI, where the developer needs to focus on the goal of the instrument rather than on the bells asd whistles. The Risk series of boards provide sufficient memory to support 1024*768, 8-bit color pixels rather than the B/W display of Oberon Version 5.
Oberon GUI is multi function. Oberon System originated as a multi function workstation by design. Its User Interface should be judged not by how it looks, but how well it is serving the planned functionality. When the original Oberon System was conceived, the last bullet "networking" had a less comprehensive scope than it has today. It basically meant "exchanging data". We note that the original definition still very much applies to instrumentation. The following functions were served by the Oberon user interface.
The initial encounter with the Oberon display. The first time user of the Oberon System may struggle with its tiled display. His/her path through the System can be two fold. Either the user refuses to adopt the system, carrying away adverse opinions about the outdated retro computer. Or the user becomes a convert, enthusiastically endorsing the Oberon GUI. It typically takes less than a week to join either one camp or the other.