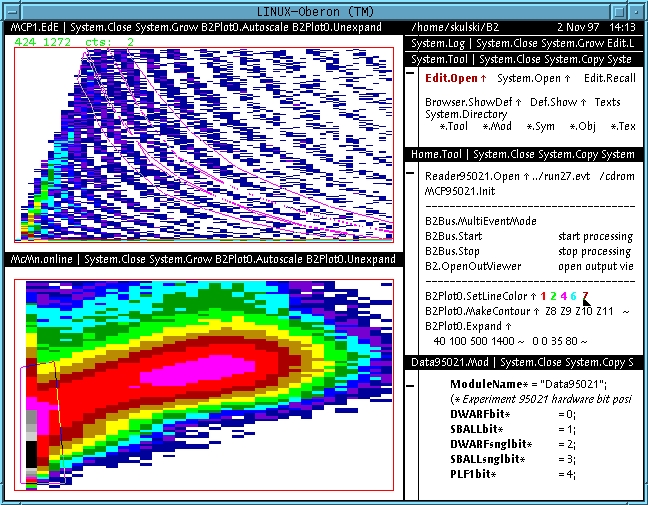
This screen shot shows two experimental histograms obtained by processing about 650 MB of raw experimental data from the experiment performed at MSU-NSCL. Both spectra are plotted as two-dimensional histograms (density plots). The colors render in a logarithmic scale a number of counts corresponding to a given histogram cell. The scale progresses from deep blue (lowest number of counts) through red to grey and black.
The upper spectrum shows a two-dimensional E-delta E spectrum from a particle telescope positioned at 20 degrees in lab. Hyperbolic concentrations of data are due to different isotopes detected in this telescope. Selection contours drawn against this spectrum allow an event-by-event selection of individual isotopes.
The lower spectrum depicts a two-dimensional plot of charged particle multiplicity Mc (horizontal coordinate) versus neutron multiplicity Mn (vertical coordinate). The concentration of counts near the origin (enclosed within the selection contour) is due to an intense component from peripheral collisions. The peninsula-like correlation between Mc and Mn is due to semi-peripheral and central collisions, where large energy dissipation causes emission of many charged particles and neutrons. The broad maximum near the center of this histogram (a purple patch) corresponds to the most violent central collisions with large energy dissipation.
The right hand side of the screen displays "tool viewers" with commands used to control processing and graphical display of experimental data, to make contours, etc. The commands can be executed by clicking with the mouse, without the need for retyping.
Please note that in order to fit a typical web display I have used an unusually small B2 screen in this case, namely 640*480 pixels. Data analysis is normally carried out with much larger screen (1k*768 pixels). If you click on the reduced picture, you will be able to see a more typical larger image.

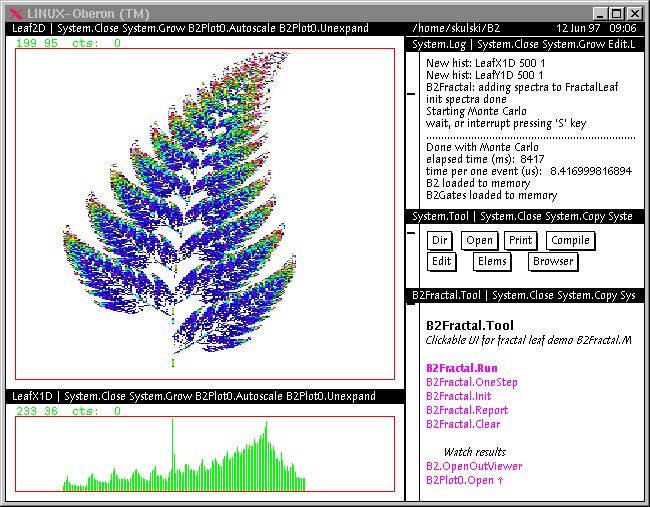
The B2 framework is operated with the Oberon run-time extensible GUI. The screen is partitioned into tiled windows termed viewers. Viewers can show either graphics or text. Graphical B2 viewers can render one-dimensional and two dimensional spectra (histograms and scatter-plots). In this example, a two-dimensional image of a fractal fern leaf and its projection on the X axis have been created in computer memory by calculating 1 million (x,y) points according to the "iterated function system" formulae. B2 spectra can be scaled (x,y, and z axes), zoomed, unzoomed, etc. One-dimensional selections (gates) and two-dimensional selections (contours) can be defined with the mouse.
B2 commands (such as B2Fractal.Run) can be activated directly from the text viewers without the need for repetitive retyping. Collections of user commands can be prepared with standard Oberon editor and saved to disk as user tools such as the example B2Fractal.Tool above. These tools are both executable by mouse clicking and editable at any time (there is no need for special "configuration phase" of the user interface). The interface can be changed at any moment by rearranging tool texts. Popup menus (small rectangular boxes) can be embedded in user tool texts to further enhance their functionality.
Data analysis code is partitioned into modules, which can be separately compiled and separately loaded to memory. Only those modules need to be loaded which are needed for a concrete data analysis project. Modules can also be selectively unloaded, recompiled, and loaded again. No data is lost from memory between compile-load cycles. The set of B2 modules is open-ended. B2 system can be extended at any time by designing new modules. Old modules need not be redesigned in order to accomodate new ones. New system extensions can be conceived, implemented, and loaded to memory, while the rest of the system remains active. The B2 system is thus extensible while it is running.
The B2 tutorial (AdvancedGuide.Text) is available from within the B2 system. It provides discussion of the B2 features, such as run-time extensibility, Oberon "safe programming" module interfaces, compile-time and run-time consistency checking, and more.